An Analysis of the NREL 10m CER Wind Turbine
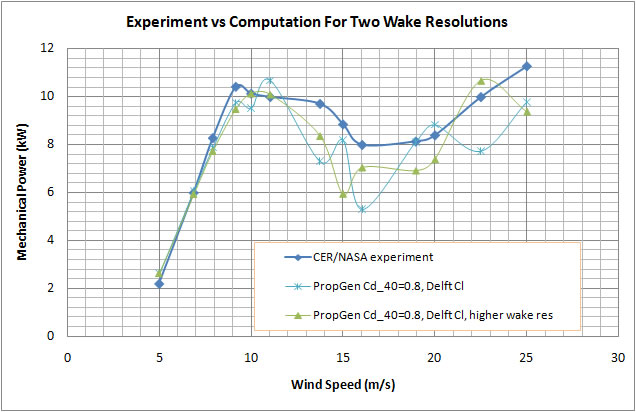
Experimental data is compared to PropGen's analysis in figure 1. The experimental setup and facility is described at http://wind.nrel.gov/amestest/.
The PropGen project file for this comparison is included in the examples directory of the v0.0.4 release. Execute project CER_tapered_10m.prp to reproduce the figure 1 results and also get details on the loading distribution, trailing vortex shape, and other properties. The "PropGen Cd_40=0.8, Delft Cl" power curve was produced by selecting a medium resolution wake in the COMPUTE_PERFORMANCE | Basic_Data dialog, and the "PropGen Cd_40=0.8, Delft Cl, higher wake res" curve was produced by selecting maximum resolution.
The deviations you see in figure 1 as wind speed increases are likely due to a combination of:
- Potentially... more than one solution is possible: Given that the wake converged for both runs, at 15m/s for example, tells me we have a consistent distribution of CL, wake angle, and circulation. There are no theoretical limitations against having more than one valid solution given sufficiently cyclical polar data such as that for the S809 in figure 2. Just as there are multiple alpha values for some CL they may be also multiple valid/converged distributions of CL, wake angle, and circulation. I need to look into this further. Note that between 11-->23m/s, the sectional alpha distribution for each solution spans multiple peaks/valleys of figure 2.
- Lack of reliable polar data for alpha greater than +-20 degrees (polar plots are below): As wind speed increases beyond 13m/s the alpha values progressively go beyond 25 degrees. Polar data beyond 25 degrees has been approximated.
- There's no "stall delay model" which could account for the deviation around 9m/s.
- A "deep stall model" may be needed: Rotor sections may behave differently from 2D testing in deep stall.
Figure 1: Power vs Wind Speed at 5 Degree Blade Angle
S809 Polar Data Description
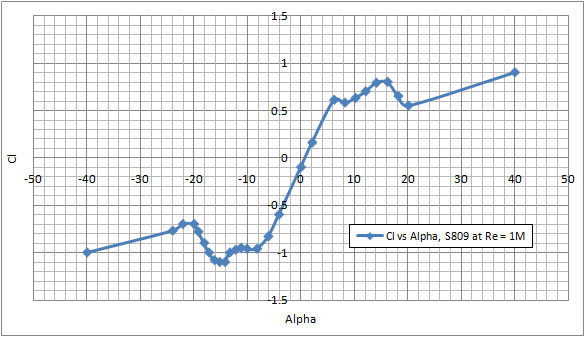
The polar data used for the computations of Figure 1 are included with the latest PropGen release (S809_Re1M.bin) and illustrated in figures 2 and 3. The polar data is primarily from Ohio State University data, but I also took the liberty of substituting alternative sources where the Cd data, for example, was too irregular. Due to a lack of polar data beyond 25 degrees, I also had to "reverse engineer" the data points shown at +-40 degrees. The reverse engineering process I followed is described below.
Note that OSU polar data has been "flipped" to respect PropGen's aircraft centric reference frame.
Figure 2:
 .
.
Figure 3:
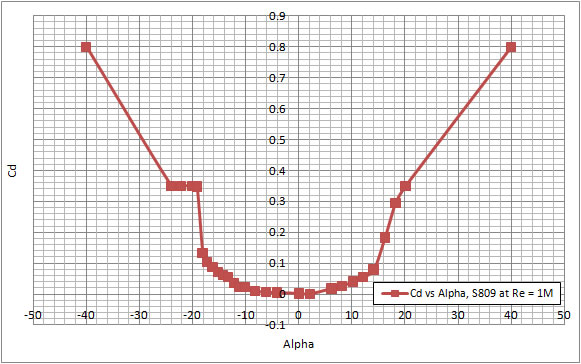
Reverse Engineering Polar Data at Alpha +-40 Degrees
I couldn't find polar data between alphas of about 25-->40 degrees so I "reverse engineered" (you may call it cheating) a fair Cd/Cl pair at +-40 degrees. The most unexpected observation from this reverse engineering operation was the dominant effect Cd played ==> Cd needs to be accurately modeled in deep stall!! At 25m/s the polar data of figures 2 and 3 will yield 9.77 kW, however, if you drop the Cd value at 40 degrees to 0.6 the power at 25m/s rises to 15.82 kW.
Figure 4:

Primary References
- http://wind.nrel.gov/amestest/
- "The Nebulous Art of Using Wind-Tunnel Airfoil Data for Predicting Rotor Performance", by J.L. Tanger
- "Investigation of the NREL NASA/Ames Wnd Turbine Aerodynamics Database", Karin Ahlund, http://www2.foi.se/rapp/foir1243.pdf